What is the QUINT-online workflow?
The QUINT-online workflow supports the analysis of 2D rodent brain microscopy data, allowing brain-wide mapping and regional quantification using a reference brain atlas. The workflow is used to quantify cells and establish maps of cell distribution, receptor densities, connectivity patterns or pathological protein accumulation in the brain. Different experimental image series can be registered to the same atlas allowing spatial integration, analysis and navigation within a standardised coordinate system.
QUINT-online combines the use of a series of applications integrated in an online workbench, accessible through EBRAINS.
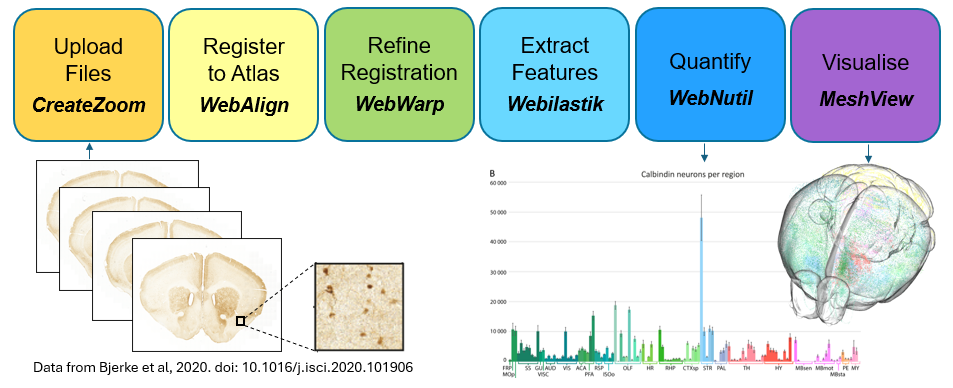
Steps in the QUINT-online workflow:
Prepare the image for upload by adding a unique identifier.
Upload the images to the workbench and convert them to the DZI format required by the tools.
Register the images to an atlas in two steps using WebAlign (linear registration) and WebWarp (nonlinear refinement).
Extract features to be quantified by segmentation using Webilastik or upload your own segmentations.
Quantify features in atlas regions using WebNutil.
Explore the results using the plotting Sandbox.
Visualise the results using the online 3D atlas viewer, MeshView.
Which atlases are supported?
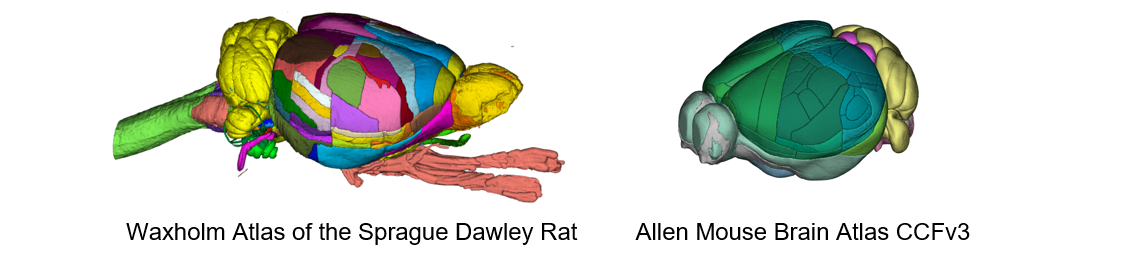
Allen Mouse Brain Atlas Common Coordinate Framework version 3 (2017) (CCFv3)
Waxholm Atlas of the Sprague Dawley rat, version 3 and 4 (WHS rat brain atlas).
What is the output of the workflow?
QUINT-online generates a series of reports in CSV and JSON format. These contain feature counts and area fraction in reference atlas regions, and atlas coordinates that can be used to visualise the features in 3D reference space using our Meshview Atlas Viewer. The results can be downloaded or explored using the plotting Sandbox.
